Serious claims statistics, 2013-17
25%
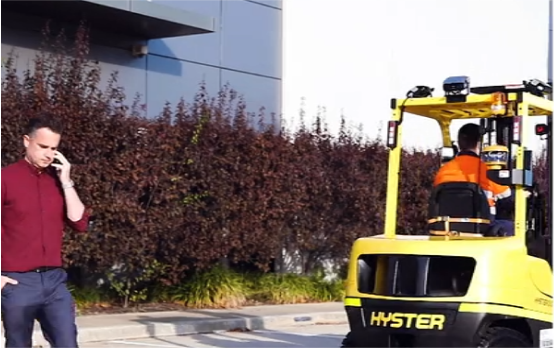
Machine/pedestrian
collisions caused by a forklift1
1/10
Forklifts involved in an accident every year2
2.5/day
Victims of
collision with
a
forklift3
1.4M$
Direct costs per death4

Overall Workplace Death Statistics:
The 2023 Death on the Job report from the AFL-CIO reveals that in 2021, there were 5,190 workers killed on the job in the United States, and an estimated 120,000 workers died from occupational diseases.
The report also notes widespread underreporting of work-related injuries and illnesses, with the true toll estimated to be between 5.4 million to 8.1 million each year in private industry
Industries with the highest death rates per 100k*
Transportation and Warehousing
15.8
fatalities per 100,000 full-time
equivalent (FTE) workers.
Total fatalities - 1,296
Construction
9.7
fatalities per 100,000 full-time
equivalent (FTE) workers.
Total fatalities - 1,081
Managers
23.8
fatalities per 100,000 full-time
equivalent (FTE) workers.
Total fatalities - 568
Fatality trends relating to high-risk industries **
Transportation & Warehousing
High numbers of fatalities often involve vehicle accidents. Inadequate safety measures for transportation and loading operations contribute to incidents.
Construction
Caught-in/between accidents are common causes.
Agriculture, Forestry, Fishing, and Hunting
Machinery-related incidents, including tractor overturns, are significant contributors.
Manufacturing
Retail Trade
Mining, Quarrying, and Oil and Gas Extraction
REFERENCES
Death on the Job report from the AFL-CIO, 2023 - US
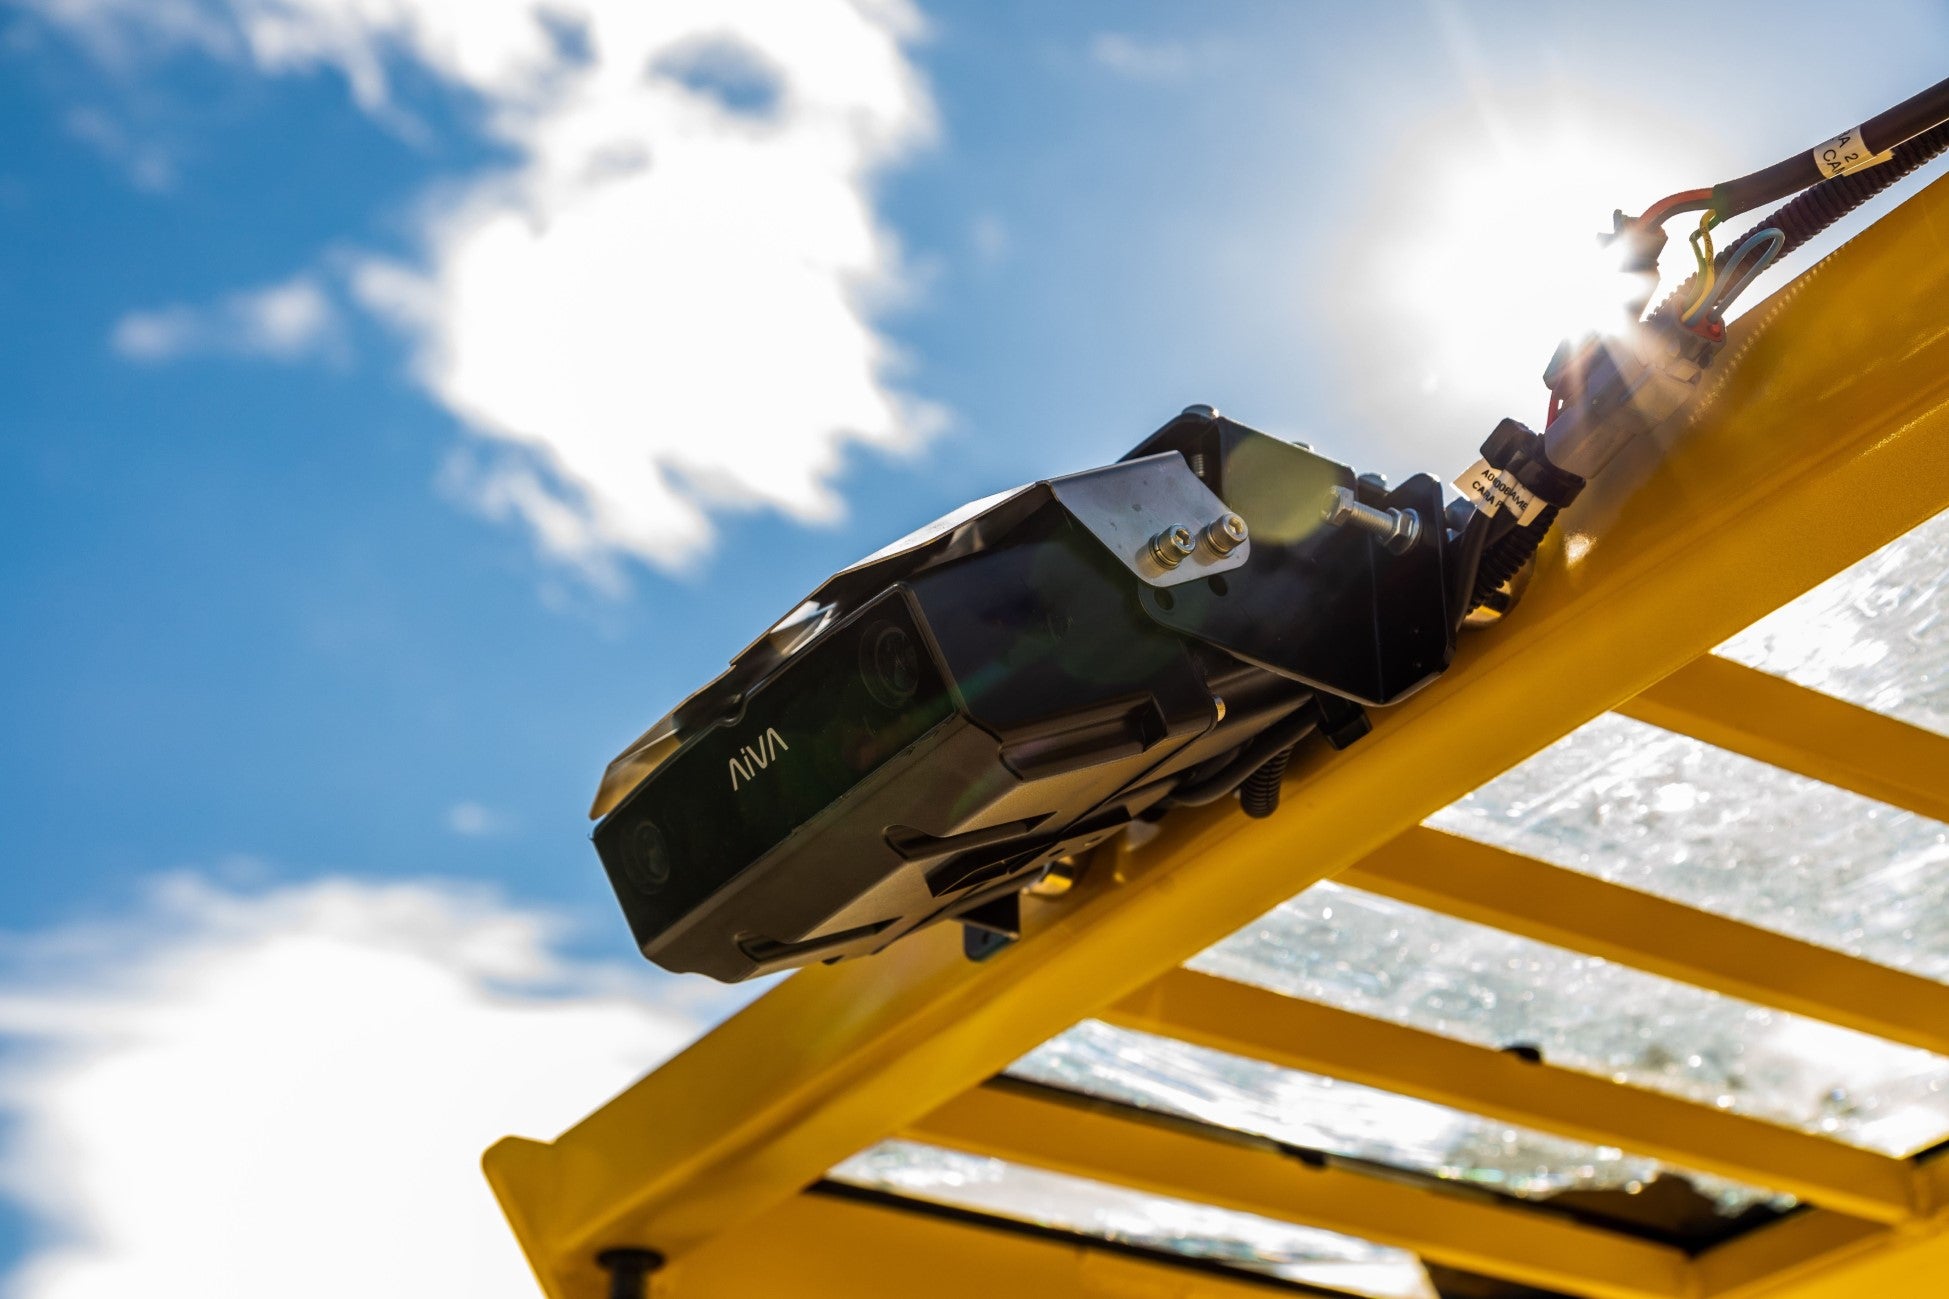
1Source: in France - EPICEA database
2Source: in the USA - Travail et sécurité No. 744 – November 2013, “Les collisions engins-piétons” (Work and Safety No. 744 – November 2013, “Machine-
Pedestrian Collisions”)
3Source: in Great Britain - British Safety Council, www.britsafe.org “A very costly forklift accident,” 09/26/2017
4Source: National Safety Council in the USA
*Source: Bureau of Labor Statistics (BLS)
**Government, Leisure and Hospitality, and, Professional and Business Services removed – workplace violence, slips and falls key issues